
The estimated tax rate of the 2026 levy is $1.09 per $1,000 of assessed property value. Collection would begin in 2027.
Enter your home value to see your estimate.
Estimate Your Monthly Property Tax Increase
Enter your home’s estimated value to calculate your monthly increase if the bond passes.
The current proposal being considered focuses on extending the life of existing facilities, reducing reliance on temporary solutions, and avoiding significantly larger costs in the future. Approval of the 2026 Capital Levy would result in an estimated increase of $1.09 per $1,000 of total assessed value. The owner of a $600,000 home would have an increase of $54.50 per month.
This proposition would authorize the District to levy the following excess taxes upon all taxable property within the District to make safety and security upgrades, expand capacity and repair building systems at school facilities, acquire and renovate property for Lynden Academy, and acquire instructional and safety technology.
| Collection Year | Estimated Levy Rate/ $,1000 of Assessed Value | Levy Amount |
| 2027 | $1.09 | $6,375,000 |
| 2028 | $1.09 | $6,375,000 |
| 2029 | $1.09 | $6,375,000 |
| 2030 | $1.09 | $6,375,000 |
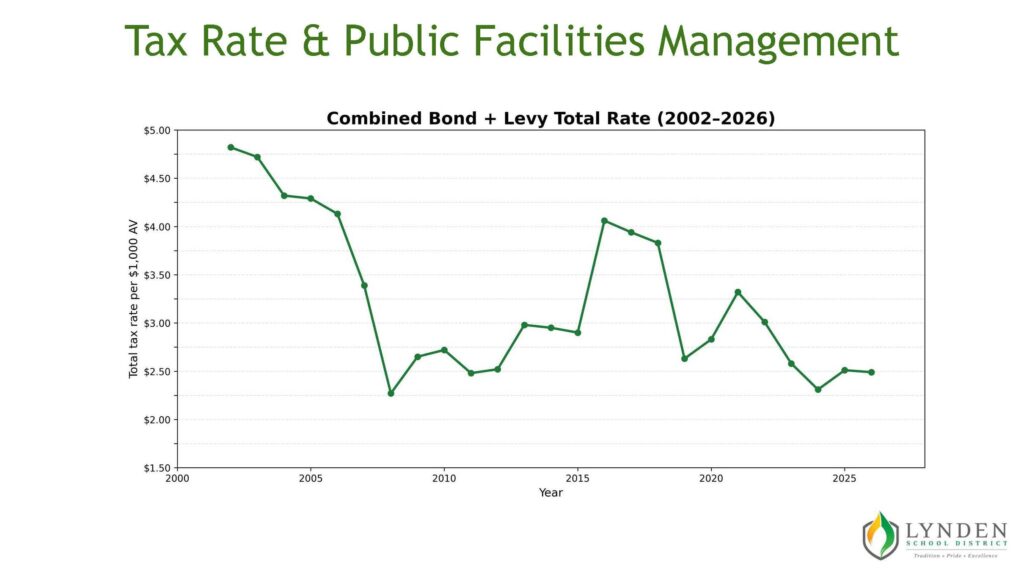
The responsibility of elected school officials is to work with the community to steward public facilities responsibly while recognizing the tax impact on residents. Over the past several years, the district completed extensive facilities planning, including four community-based planning teams. Voters were first asked to consider a comprehensive capital bond, which did not reach the required 60 percent approval threshold. After two more attempts focused only on replacing Lynden High School, the Board concluded that doing nothing was not responsible stewardship of public assets. Needs don’t go away and costs continue to increase. Lynden Schools elected officials have managed tax rates responsibly and are committed to doing so in partnership with the community’s residents. The chart below shows the tax rates for past 25 years.
Whatcom County School District Tax Collection Comparison
Tax rates vary among school districts due to differences in property values and locally approved funding measures. This is the system in place for communities to construct and maintain its public facilities.
| District | 2025 Property Assessed Value | 2025 Millage Rate per $1,000 | 2025 Total Tax Collection |
|---|---|---|---|
| Bellingham | $29.5 Billion | $3.07 | $90.7 Million |
| Ferndale | $9.3 Billion | $2.21 | $20.7 Million |
| Blaine | $7.8 Billion | $1.35 | $10.5 Million |
| Lynden | $5.4 Billion | $2.51 | $13.6 Million |
| Mount Baker | $3.9 Billion | $1.86 | $7.2 Million |
| Meridian | $2.7 Billion | $3.24 | $8.6 Million |
| Nooksack | $2.2 Billion | $3.36 | $7.3 Million |
Tax Exemptions
If you are a senior citizen or a person with disabilities with your residence in Washington State, you may qualify for a property tax reduction under the property tax exemption for senior citizens and people with disabilities program.